Item models are a commonly used to store data in Qt applications, so the Qt Data Visualization enterprise add-on offers ready-made data proxies to facilitate the visualization of data stored in these models. The basic usage is the simple item model role to data item value mapping, but with Qt Data Visualization 1.1, more powerful options to map model data have become available.
Basic use cases
Direct one to one mapping
The most basic use case of one-to-one mapping is demonstrated in Qt Quick 2 Scatter Example, where the data we want to visualize is stored in a simple ListModel like this:
ListModel {

    id: dataModel

    ListElement{ xPos: -10.0; yPos: 5.0; zPos: -5.0 }

    ListElement{ xPos: -9.0; yPos: 3.0; zPos: -4.5 }

    // And so on...

}
To make a 3D scatter series out of the above data, we specify a ItemModelScatterDataProxy to map the data into a Scatter3DSeries:
Scatter3DSeries {

    id: scatterSeries

    ItemModelScatterDataProxy {

        itemModel: dataModel  // The source model for data

        xPosRole: "xPos"  // Map model role "xPos" value to data item X position.

        yPosRole: "yPos"  // Map model role "yPos" value to data item Y position.

        zPosRole: "zPos"  // Map model role "zPos" value to data item Z position.

    }

}
This results in the scatter series with one item per ListElement in the ListModel, where the coordinates are taken from the ListElement roles as specified by the above mapping.
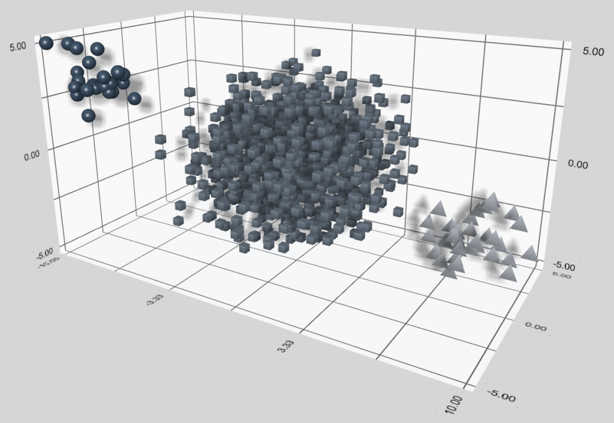
Table controls
Another basic use case is having a table control such as QTableWidget and creating a visualization out of that. QTableWidget stores the data in an item model, which already has data sorted into rows and columns. This use case is demonstrated in the Item Model Example. Since the data is already in rows and columns, we don't need to map roles for those when visualizing using a bar graph or a surface graph, making our proxy very simple:
QItemModelBarDataProxy *proxy = new QItemModelBarDataProxy(tableWidget->model());

proxy->setUseModelCategories(true);

QBar3DSeries *series = new QBar3DSeries(proxy);
We indicate we want to use the existing rows and columns by setting the property QItemModelBarDataProxy::useModelCategories. We don't need to define a role for value mapping either, because Qt::DisplayRole is used by default.

Advanced usage
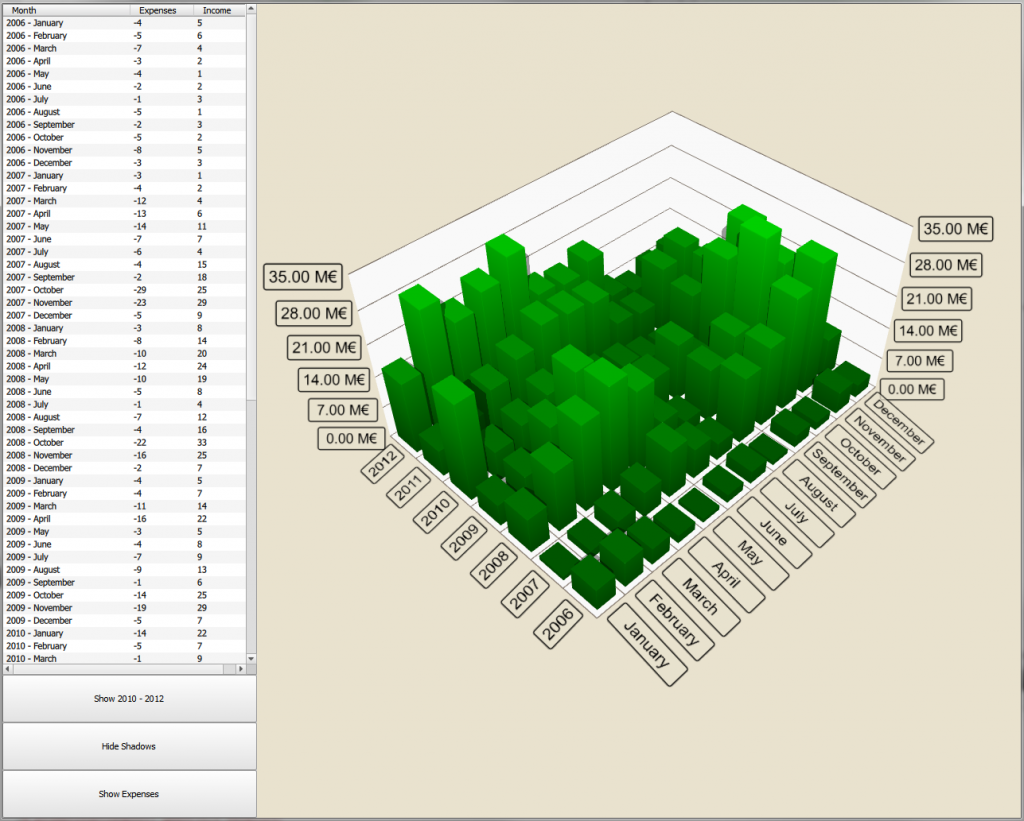
Search and replace
Sometimes the model data is not suitable for one-to-one mapping. A typical use case for this is extracting different portions of a timestamp role to map for rows and columns. For example, you might want each row to represent one year and the columns to represent months of the year. Item model proxies of Qt Data Visualization support this use case via search and replace functionality, which allows you to modify the role contents before mapping it. An example of this can be found in Qt Quick 2 Bars Example, where the data is in the following format:
ListModel {

    id: dataModel

    ListElement{ timestamp: "2006-01"; expenses: "-4";  income: "5" }

    ListElement{ timestamp: "2006-02"; expenses: "-5";  income: "6" }

    // And so on...

}
To parse the timestamp role into both rows (years) and columns (months), we utilize a proxy like this:
ItemModelBarDataProxy {

    id: modelProxy

    itemModel: dataModel

    rowRole: "timestamp"

    columnRole: "timestamp"

    valueRole: "income"

    rowRolePattern: /^(\d\d\d\d).*$/  // Pattern to capture the year in the timestamp

    columnRolePattern: /^.*-(\d\d)$/  // Pattern to capture the month in the timestamp

    rowRoleReplace: "\\1"

    columnRoleReplace: "\\1"

}
The role patterns above are regular expressions that match the entire content of the timestamp role and capture the desired portion, either the year or the month. Specifying "\\1" as role replace indicates that we want to keep only the captured part of the role. For more information how search and replace using regular expressions works, see QString::replace function documentation.
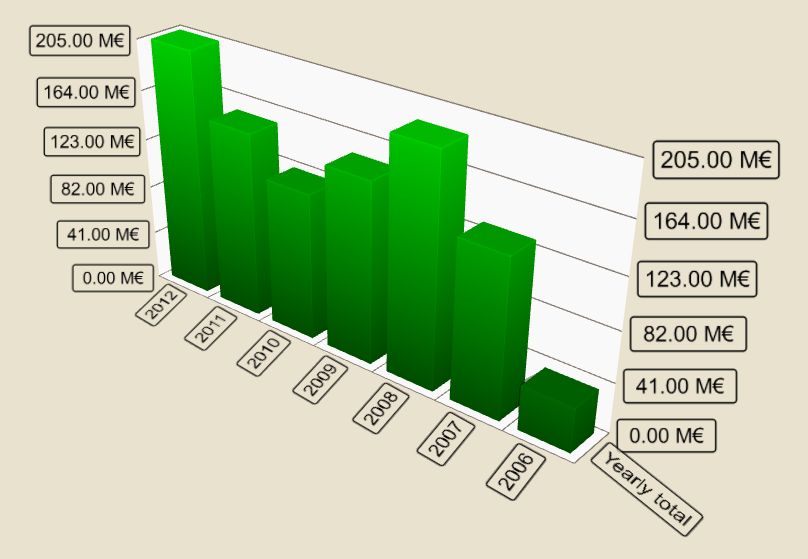
Dealing with multiple matches
When assigning data into rows and columns, sometimes more than one data item matches the given row/column combination. Depending on the use case, you might want to just take the first match, average the matches out, or add all matches together. Qt Data Visualization item model proxies introduce multiMatchBehavior property, which you can use to specify the desired behavior in case multiple data items in the source model match any row/column combination. An example of this can be found Qt Quick 2 Bars Example, where one option is to view yearly totals. The proxy to achieve this would be similar to the one above, except with two differences:
ItemModelBarDataProxy {

    // ...

    columnRolePattern: /^.*$/  // Match everything

    multiMatchBehavior: ItemModelBarDataProxy.MMBCumulative

}
By having a column role pattern that matches every data item means that we will only have a column on each yearly row, and there will be exactly twelve matches for each row. The cumulative behavior we specify indicates that all matching data item values should be added together into a single bar.
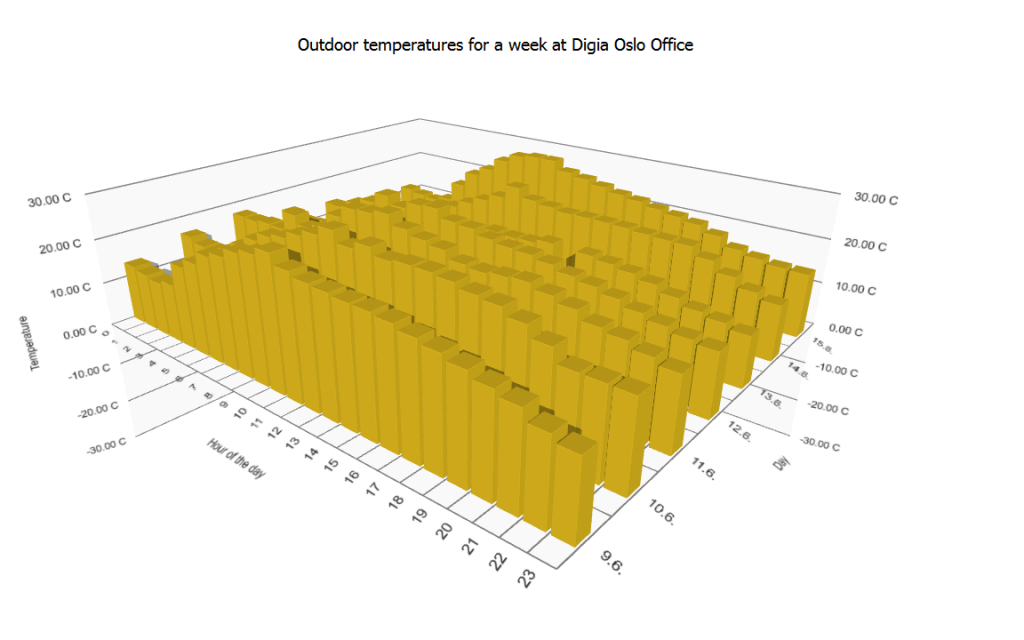
Visualizing data from the cloud
The Enginio module provides a convenient way to load data from the cloud into an item model, the EnginioModel, which means visualizing the data from the cloud is possible using Qt Data Visualization item model proxies. For example, suppose we have a weather monitoring application that stores weather data into the cloud and a separate client application, where we want to show a history graph of the stored data. In the client application you would do this to get the data from the cloud:
EnginioClient {

    id: enginioClient

    backendId: "my_weather_data_backend_id"

}

EnginioModel {

    id: enginioModel

    client: enginioClient

}

function queryHistory(startDate, endDate, enginioModel) {

    enginioModel.query = {

        "objectType": "objects.weatherRecords",

        "query": {

            "createdAt": {

                "$gte": {

                    "$type": "time",

                    "$value": startDate

                },

                "$lt": {

                    "$type": "time",

                    "$value": endDate

                }

            }

        },

        "limit": 500

    }

}
Suppose we want to display the data with each row representing the day and each column representing the hourly average of measurements. The data proxy to display this data would be like this:
ItemModelBarDataProxy {

    columnRole: "createdAt"  // example createdAt role content: "2014-04-29T13:51:02.787Z"

    rowRole: "createdAt"

    valueRole: "outdoorTemperature"

    itemModel: enginioModel

    rowRolePattern: /^\d*-0?(\d*)-0?(\d*)T.*/i  // Capture the month and the day

    columnRolePattern: /^\d*-\d*-\d*T0?(\d*):.*$/i  // Capture the hour

    rowRoleReplace: "\\2.\\1."  // "day.month.", e.g. "12.6."

    columnRoleReplace: "\\1"  // Just the hour

    multiMatchBehavior: ItemModelBarDataProxy.MMBAverage

}