We’re happy to announce that the upcoming Qt 5.6.0 release includes Qt Charts 2.1.0 add-on. This Qt Charts release contains new features and bug fixes based on customer requests.
A short introduction of the module to those of you new to it: Qt Charts is a module that provides a set of easy to use chart components. Different chart types that are available: Line, Spline, Area, Scatter, Bar, Pie, Polar and Box-and-Whiskers Chart.
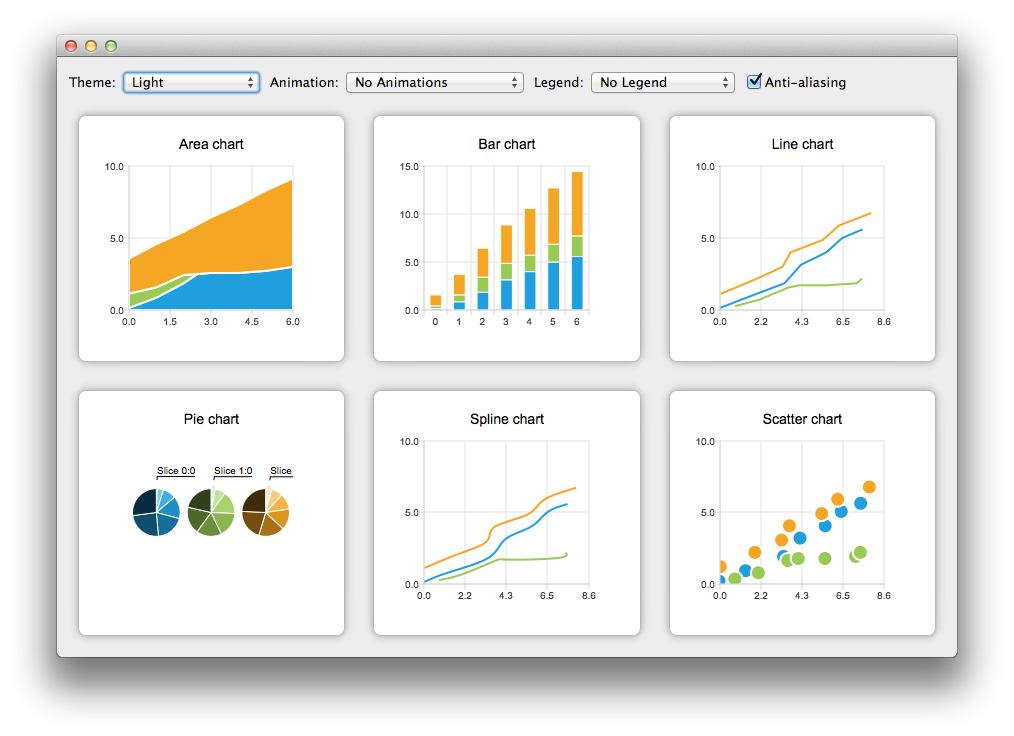 Example of some chart types available
More information, including examples of Qt Charts usage, can be found from the documentation.
As announced recently, the Qt Add-ons licensing will be changed so that the Qt Charts module becomes available under both GPLv3 and commercial license terms. The source code for the module has already been pushed to codereview.qt-project.org. With Qt 5.7 release the packages will include a pre-built version of the module and the version numbering for Qt Charts will then be changed so that it follows the Qt versioning.
Performance improvement
The biggest visible improvement done to Qt Charts 2.1.0 is a performance related change. For line and scatter series we’ve added support of accelerated drawing with OpenGL. The change radically improves performance in cases involving large data sets. We’ve added the OpenGL Accelerated Series Example to show how you can enable OpenGL acceleration for QLineSeries and QScatterSeries.
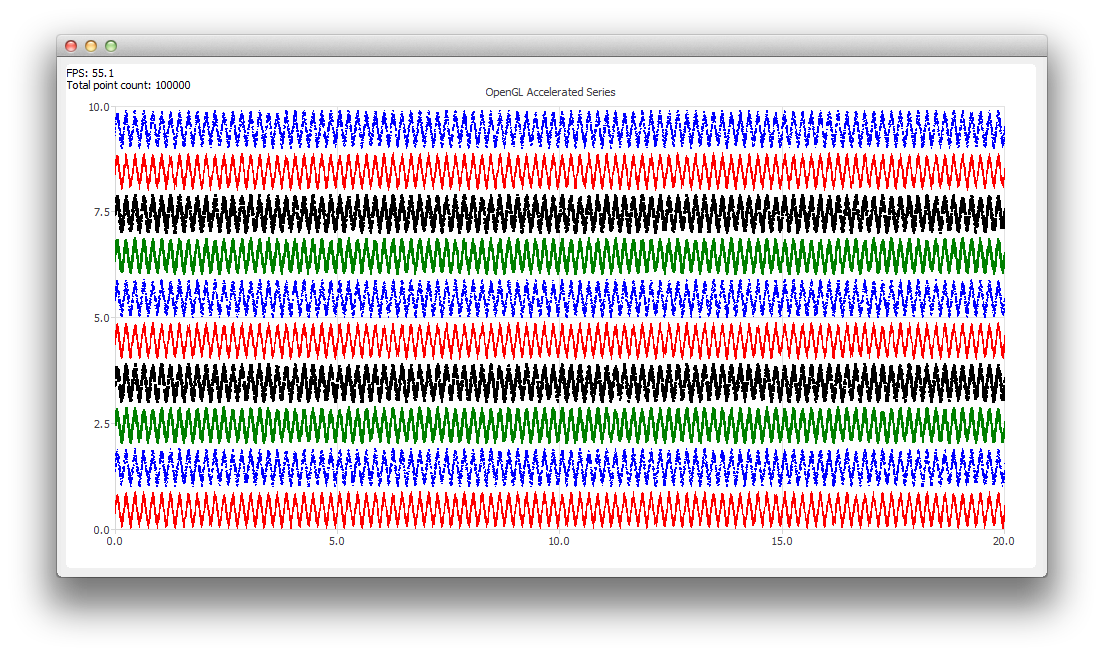 Large data set shown in the OpenGL Accelerated Series Example
New features and functionality in Qt Charts 2.1.0
- Reverse axis support
- Possibility to set labels position for QCategory Axis
- Support for minor ticks to value axis
- Support for bar series value label angle
- Points can be replaced and get as a QVector with QXYSeries
- Duration and easing curve can be set for chart animation
- Labels clipping can be enabled and disabled
- Possibility to remove more than one point from QXYSeries
- Color of the grid can be set with axis
- mapToPosition and mapToValue methods to ChartView
- Zooming functions to ChartView to correspond the ones available for QChart
- Changed signals to scatter series marker size and shape properties
In addition to the above changes there are also several fixes done based on customer reports. For detailed list of changes please see the dist/changes-2.1.0 file included in the source package of Qt Charts.
Qt Charts 2.1.0 is already included as a source package in Qt 5.6 Beta. The final Qt 5.6 release will also include the binaries for this add-on. In Qt 5.6 release the module binaries will still be available only with the commercial packages. Open source users can build the module from the sources. As always, Qt Charts is fully covered by our standard support. Should you have any issues using the module or in case you want to share your ideas for further development, please contact our support team through the Qt Account Support Center.