Now that Qt 3D Studio 2.0 has been released, let's look at what some of the new features enable. In particular, we will visit the so-called in-scene debug and profile views, as these handy, built-in (both to the viewer launched from the editor and, if the developer decides so, to applications) views allow answering questions like What happens between loading a scene and issuing OpenGL draw commands?, Is this 3D scene too heavy?, How much graphics resources does this scene use?, or Is there any chance this scene will perform on this or that embedded hardware?
Note that this post assumes a certain level of familiarity with the basic concepts of Qt 3D Studio. For an introduction, refer to the editor and runtime Getting Started pages of the documentation.
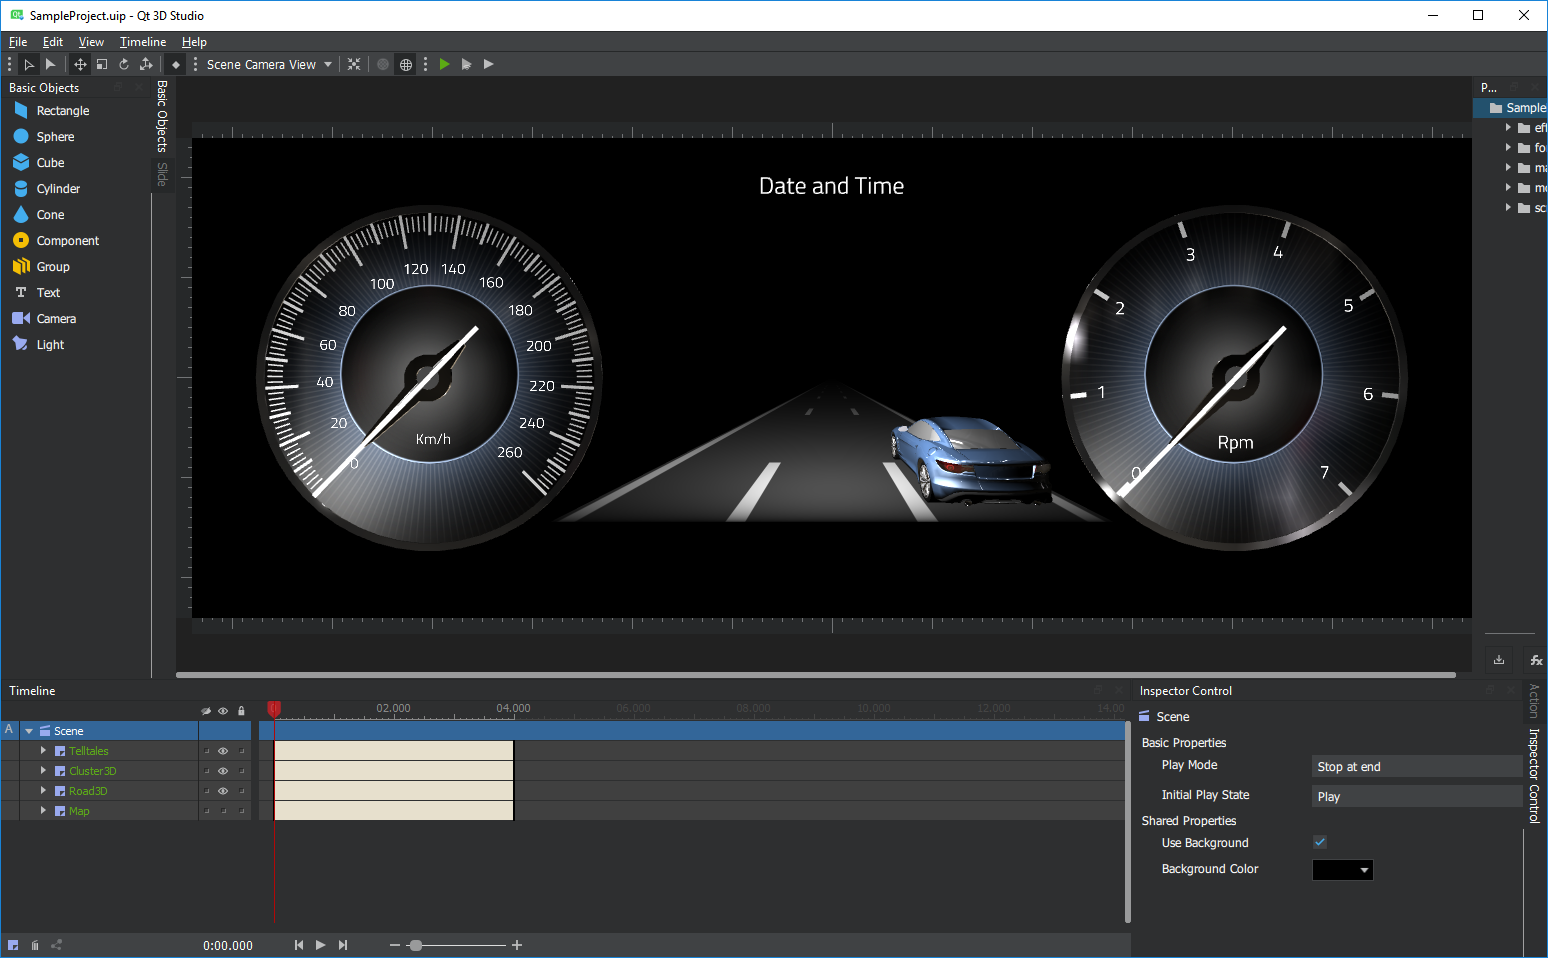
Firing up the viewer by clicking the green Play button in the toolbar of the Qt 3D Studio application launches q3dsviewer, which is a simple Qt application that uses the Qt 3D Studio Runtime to load and render the presentation into a QWindow. With 2.0 and its migration to a new engine that is using Qt 3D internally, the viewer now offers a menu item View/Profile and Debug (or just press F10). We will use the viewer in the following examples but it is worth remembering that all this is available to any application using the runtime.
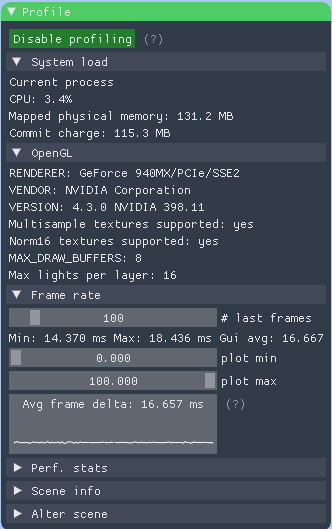
First, we have some quite standard information up there: (note that everything is live and updated every frame)
- OpenGL - useful on some platforms to verify the application is indeed running against the desired implementation, or to see if the runtime is using its OpenGL ES 2.0 level reduced functionality mode (see the System Requirements page in the documentation for more in this).
- CPU and memory usage (available on Windows and Linux (incl. Android))
- and of course, the frame rate (with a simple, configurable visualization even).
Given that this is built-in and is rendered in-scene (so works with platform plugins like eglfs as well), and so can be brought up on any embedded device, this view alone can be quite valuable during the development phase.
The rest is a bit more tricky since some of it may need some understanding of what happens under the hood. Some of you may remember a Qt World Summit talk from last year, discussing implementing a "runtime on top of Qt 3D". This describes the concept well and is still valid today. In short, the Qt 3D Studio editor generates .uip (and .uia) files which are XML documents describing the scene and other things.
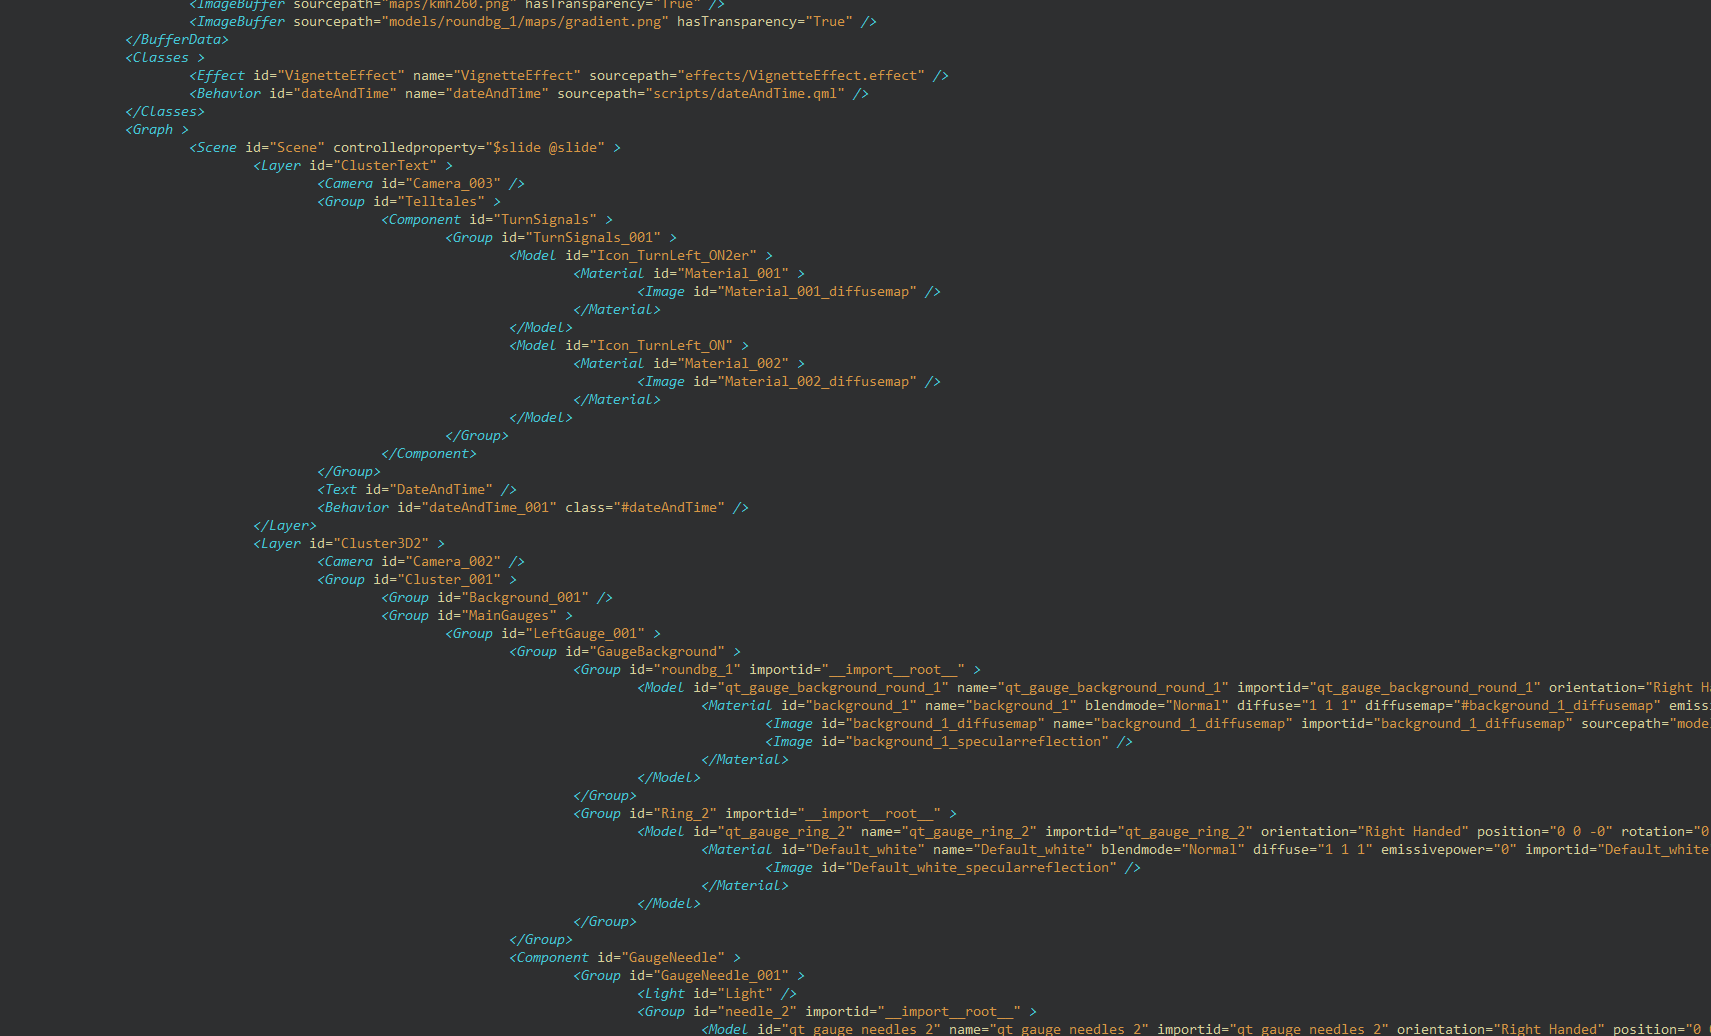 Excerpt from SampleProject's .uip file
(click on the images for a full size view!)
Now, before anyone gets a shock from all that XML stuff, the good news it that this is basically irrelevant. The format may change arbitrarily in the future, and could be JSON, a binary blob, or QML even (hint hint...). It is just a serialization format in its current form. What matters is the scene (and slide) trees that are then created by the runtime when parsing this input. The concept is very similar to the scene graph of Qt Quick, where the QQuickItem tree is backed by a QSGNode tree. With Qt 3D Studio the QQuickItem tree has no equivalent (yet! (hint hint...)) and we are building up a Q3DSGraphObject tree either by parsing the XML document or programatically with a (currently private) C++ API.
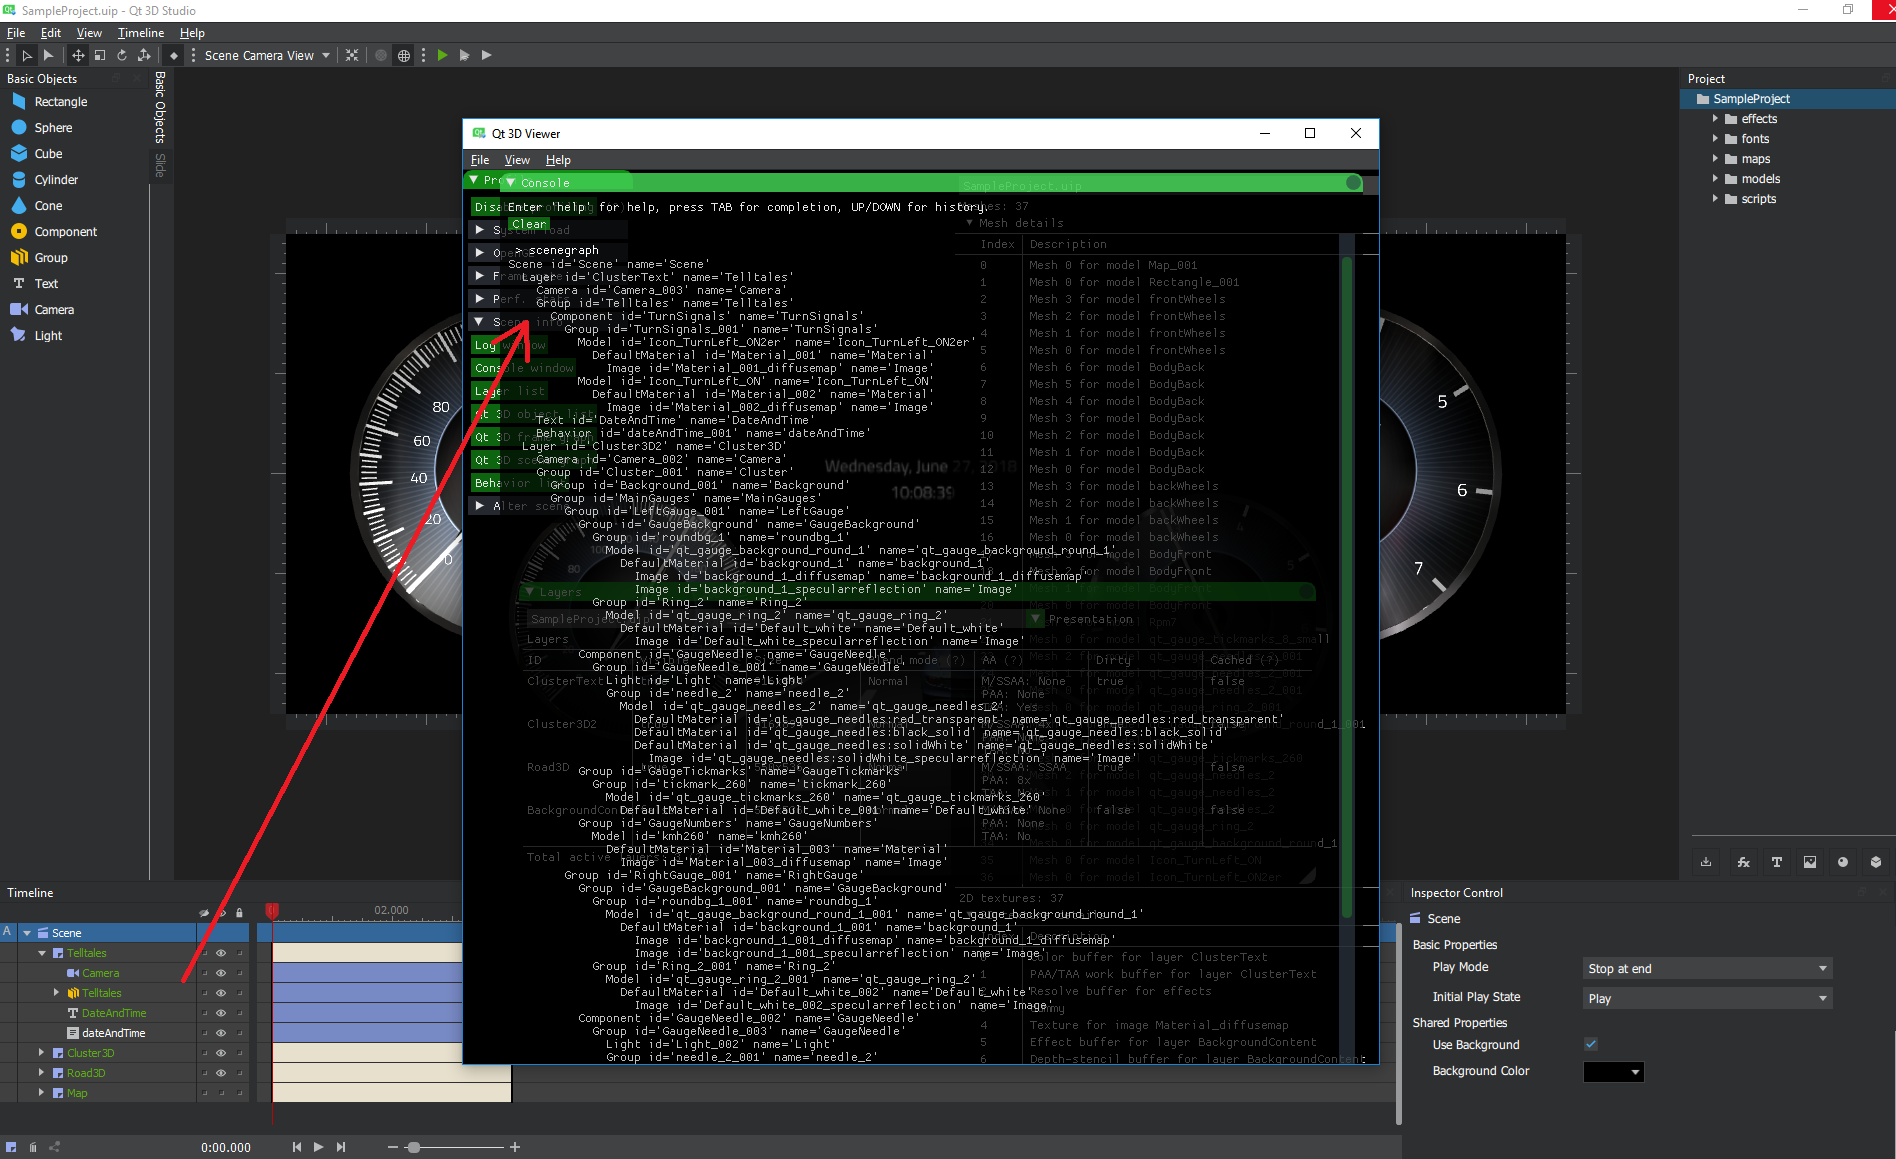 SampleProject scene structure
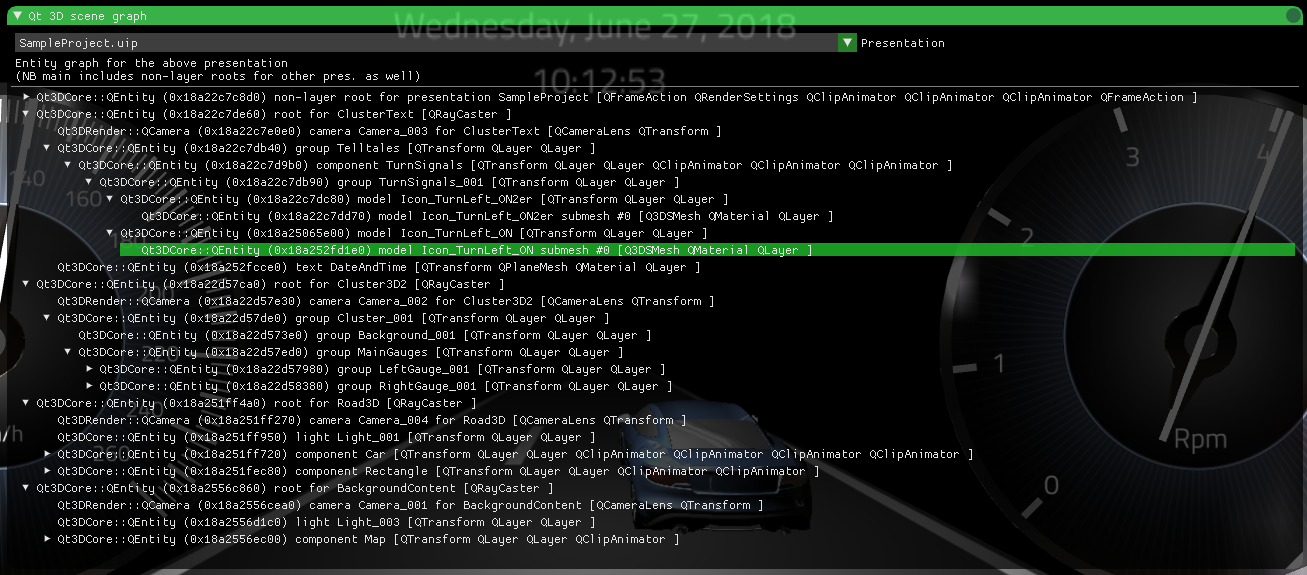
The (experimental) console's scenegraph command shows this very well. Bringing up the console from the Scene Info section and typing scenegraph prints the Q3DSGraphObject tree. Unsurprisingly, this matches almost completely the scene tree in the editor's Timeline view.
Note that at this point we still have nothing to do with actual graphics resources, APIs like OpenGL, or drawing anything on screen. We could just have stopped here, manipulate our Q3DSGraphObject tree a bit, and then maybe serialize it back to a file, without ever initializing anything graphics related. Graphics only comes in the picture in the next step:
 The generated Qt 3D entity graph(the Qt 3D entity graph viewer is not available in 2.0 but is already merged to the master branch and will therefore be place in 2.1 later this year)
For those who have experience with Qt 3D this probably is starting to look familiar.
Based on the Q3DSGraphObject tree, a Qt 3D framegraph and scene (entity) graph are generated and kept up-to-date in sync with any changes to the Qt 3D Studio data structures. It is then up to the Qt 3D renderer to manage graphics resources (textures, buffers) and generate draw calls based on the entity and framegraphs.
Model nodes become entities with one or more child entities (one for each sub-mesh) which have components like a material and a Q3DSMesh (a QGeometryRenderer subclass) on them, thus turning them into renderable entities. Each of these will lead to eventually issuing an OpenGL draw call (glDrawElements or similar).
The QLayer components show how the "tagging" to differentiate between the opaque and transparent (and sometimes other) passes is done in practice: the renderable entities (the ones with Q3DSMesh on them) only have one QLayer component associated since they belong either to the opaque or the transparent pass, but not both. The ancestors, like the parent "model" entity, or entities corresponding to group nodes have 2 QLayers since these are non-renderable (no draw call is generated for them) and their transform has to be taken into account in all passes.
Text is (for now) done by rendering into a QImage with the raster paint engine (QPainter) and then drawing a textured quad, as witnessed by the single entity generated for the DateAndTime text node.
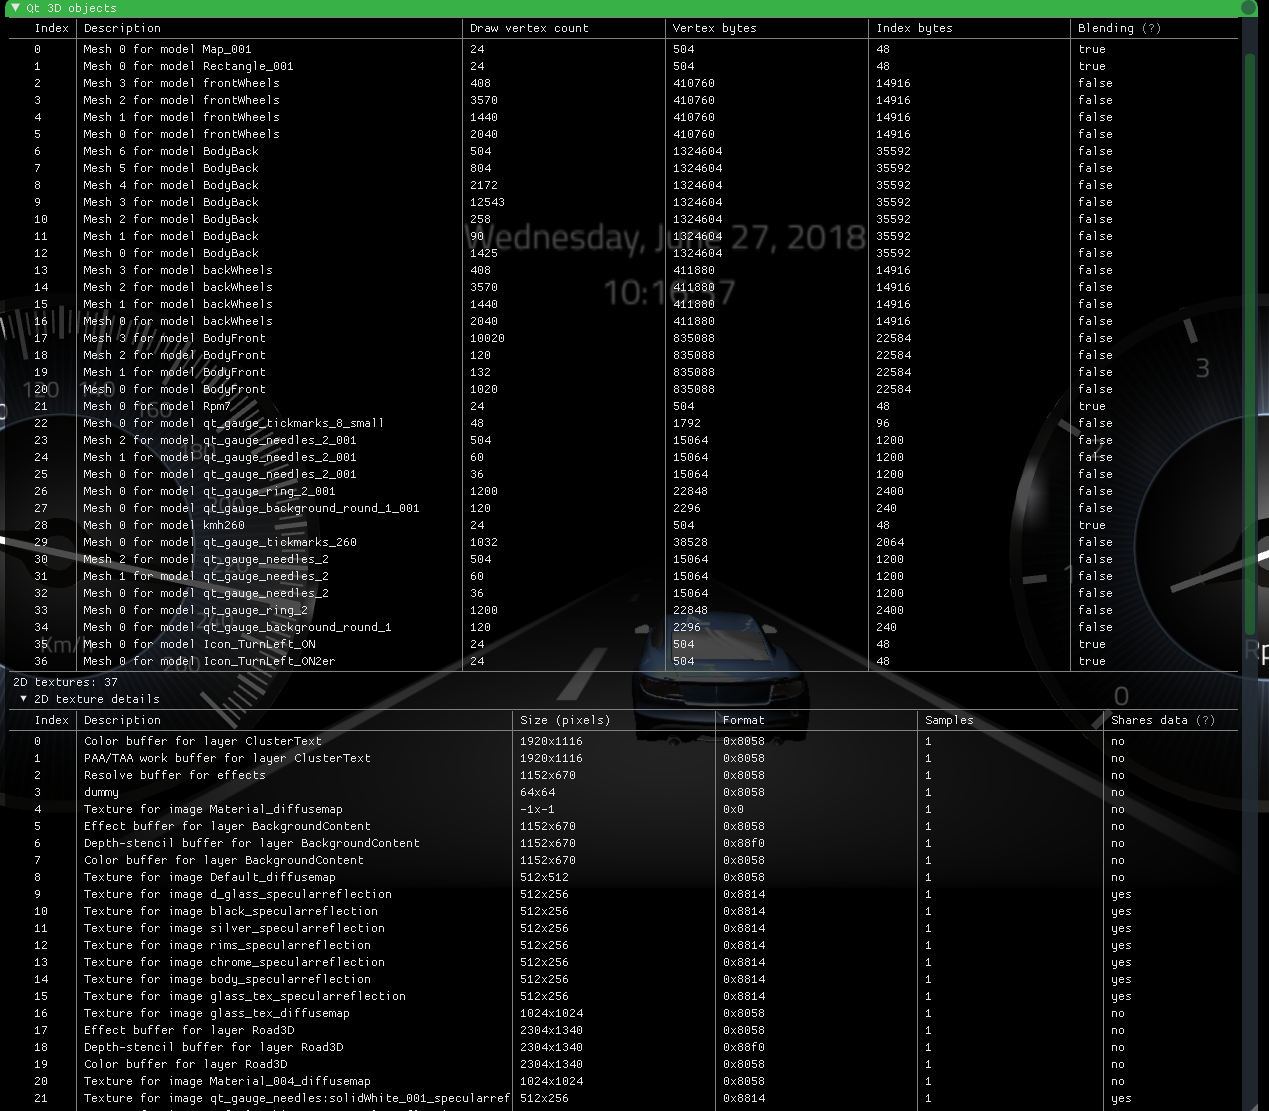
This in itself does not tell much about the number or size of graphics resources. To help designers and developers getting an overview of the approximate graphics resource usage, the Qt 3D Studio runtime tracks some of the relevant Qt 3D objects it creates, in particular texture and buffer instances which under the hood lead to create OpenGL texture and buffer objects. This is what is shown in the Qt 3D Objects view:
 Qt 3D object list
- Is the model the designer provided too complex? Seeing a lot of submeshes with lots of data in them should raise a flag right away. Such meshes may render just fine on a desktop PC but can cause performance issues on an embedded device.
- Are we wasting time on unnecessary blending? Blending means the object belongs to the transparent pass and so the mesh is rendered with together with the other "transparent" meshes with blending enabled, sorted back-to-front. This is unnecessary and wasteful if there is in fact no need for full or partial transparency.
- Are the texture maps too large? A quick look at the texture list can reveal another set of potential problems that may pop up when deploying to a more constrained target platform.
- Is multisample antialiasing in use? MSAA may make things look nice on the design PC but may be too much to ask from some of the typical embedded devices today.
Pay attention to the Shares data column. Two rows in the texture list does not mean there are two OpenGL textures active. For example, using the same file as the source of more than one texture map will often lead to reusing the same data and ending up with using the exact same OpenGL texture object under the hood.
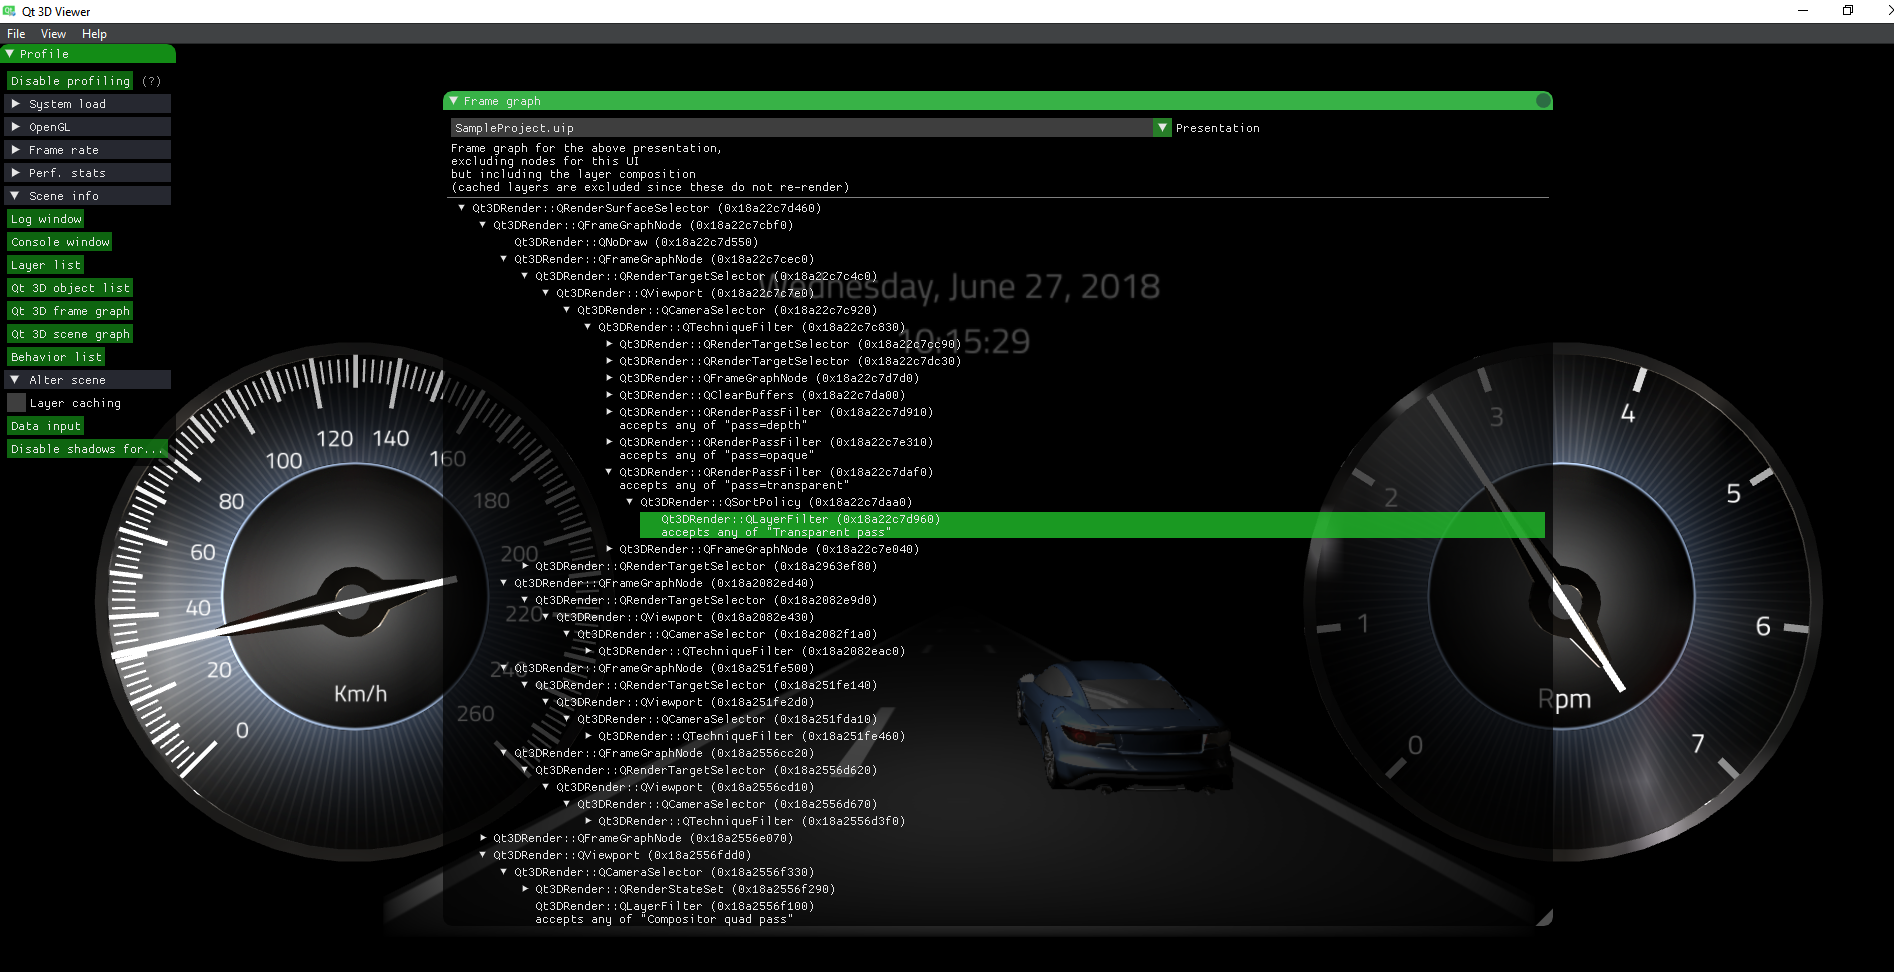
Now that we have the data to render with (geometry, shaders, textures), what is left is to define how exactly the rendering is to be done. This is ensured by generating and maintaining a Qt 3D framegraph:
 SampleProject Qt 3D framegraph
This framegraph view is likely not that essential for typical users. It is most useful to those who are looking for deeper understanding and to develop the runtime.
Note that Layer Caching option in the Alter Scene section on the left. (do not confuse Qt 3D Studio layers with Qt 3D QLayers: in Qt 3D Studio a scene consist of one or more layers, each of which acts as a mini-scene with its own 2D backing store (OpenGL texture in practice), which are then composed together with a simple (or sometimes not so simple) texture blit as the last step in the rendering process - this is no different than Qt Quick layers in fact. Qt3D's QLayer has nothing to do with this and can rather be thought of as a tag that can be attached to entities to allow filtering them.)
When there is no change in a layer (nothing is animated), there is no need to re-render the contents of it for the next frame, the existing texture contents can be used for composition as-is. This is implemented by dynamically taking out/re-adding framegraph node subtrees from/to the framegraph. This is also reflected by the live framegraph view, so to get a full overview of what the rendering of the scene involves, turn Layer Caching off temporarily.
One may wonder why there are seemingly useless QFrameGraphNode objects with a sole QNoDraw child in the tree. The reason is that subtrees may be generated inserted dynamically upon certain conditions (say a light becomes shadow casting, SSAO gets enabled, progressive AA gets enabled for a layer, etc.), and these "dummy" nodes with their no-op child leaf are placeholders.
Enough of tree views, back to the simpler tables:
 SampleProject layer list
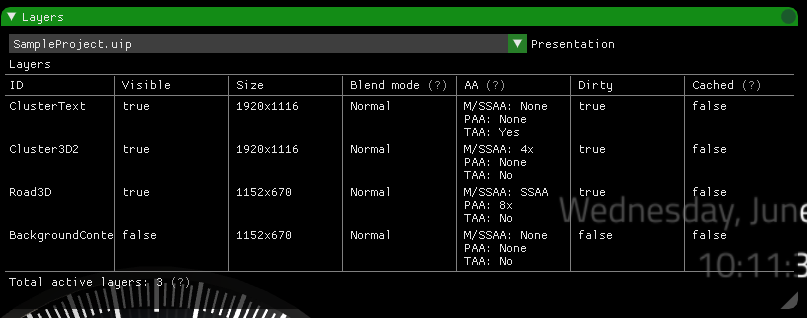
The Layer list shows all the Qt 3D Studio layers. Each of these has one or more corresponding textures in the Qt 3D Objects view. Watch out for things like:
- Are the antialiasing settings sane? See this documentation page for an overview of the available AA techniques. All of them come at a cost when it comes to performance and resource usage.
- Are the Dirty and Cached values as expected? Layers that have no animations running in them are expected to be in Dirty == false and Cached == true state (thus avoiding re-rendering the contents every frame).
- If an advanced blend mode (overlay, color burn, color dodge) is used, make sure it is really required as these involve additional resources and expensive extra blits.
Note the Presentation combo box that is present in this and many other views. Qt 3D Studio allows using multiple sub-presentations, as explained here. The contents of sub-presentations are rendered into textures which are then used either as the contents of some layer in the main presentation, or as texture maps for some material. As the main and the sub-presentations each have their own Q3DSGraphObject tree, most related functionality in the console and in the debug views is organized on a per-presentation basis. Use the combo box or the appropriate console command to switch between the presentations.
Finally, note that there is extensive qDebug output from the runtime. The debug messages are also collected and shown in the Log view. This allows easy filtering, allowing turning off uninteresting messages. The most interesting categories are q3ds.perf, q3ds.scene, and q3ds.uip.
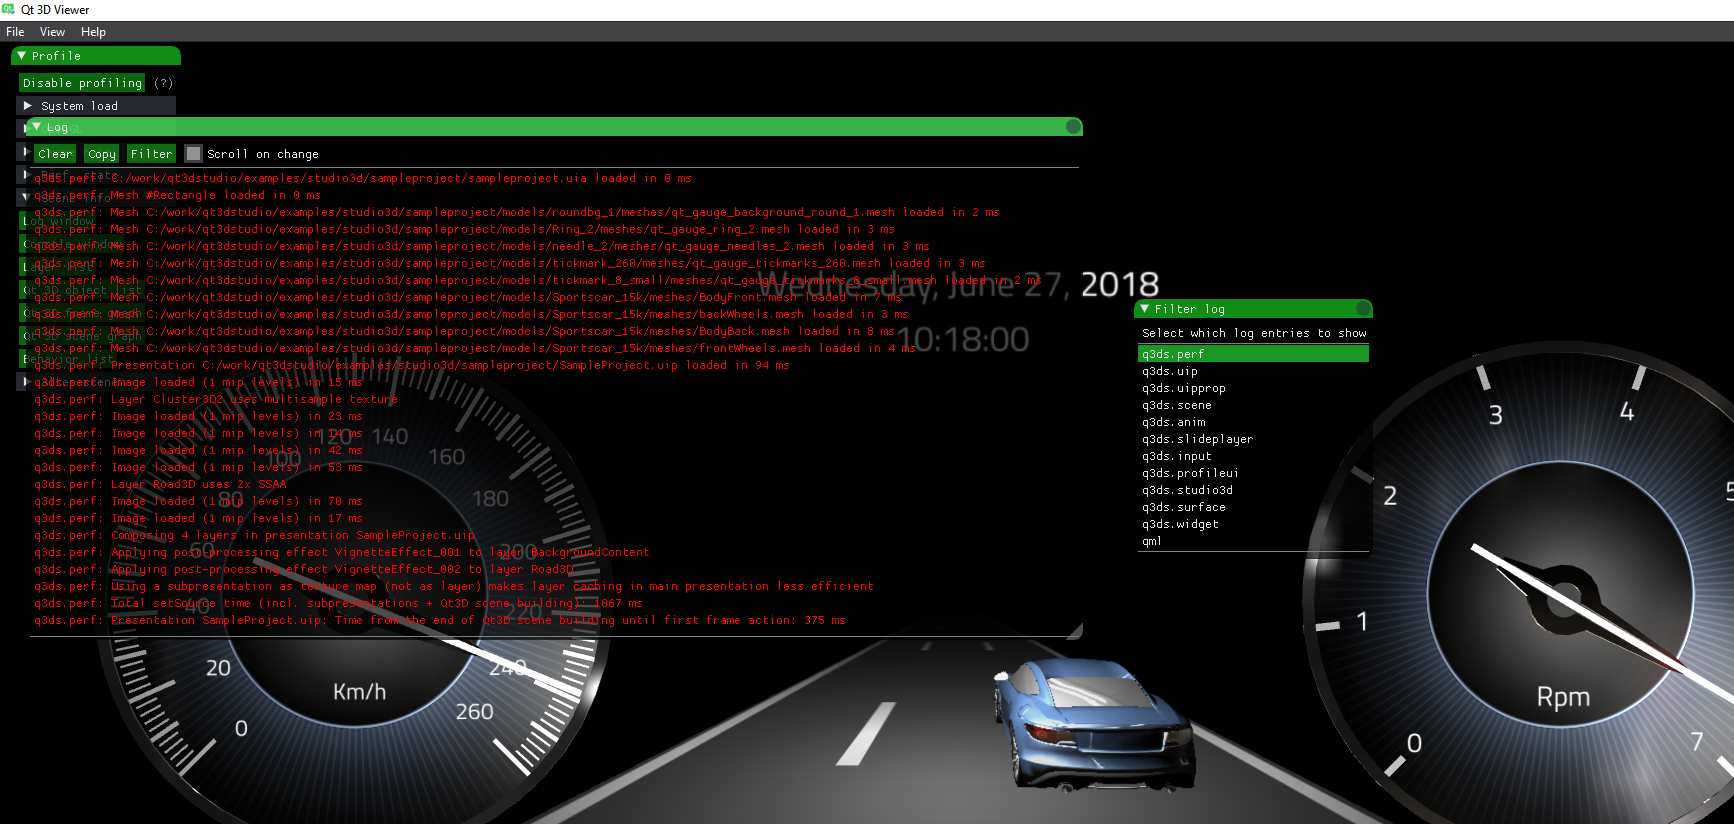 q3ds.perf log messages
Certain operations that are considered especially heavy will trigger a q3ds.perf message. This can be helpful to recognize some less optimal design choices in the presentations.