The Performance Analyzer
You may have heard about the Performance Analyzer (called "CPU Usage Analyzer" in Qt Creator 4.6 and earlier). It is all about profiling applications using the excellent "perf" tool on Linux. You can use it locally on a Linux-based desktop system or on various embedded devices. perf can record a variety of events that may occur in your application. Among these are cache misses, memory loads, context switches, or the most common one, CPU cycles, which periodically records a stack sample after a number of CPU cycles have passed. The resulting profile shows you what functions in your application take the most CPU cycles. This is the Performance Analyzer's most prominent use case, at least so far.
Creating trace points
With Qt Creator 4.7 you can also record events for trace points, and if your trace points follow a certain naming convention Qt Creator will know they signify resource allocations or releases. Therefore, by setting trace points on malloc, free, and friends you can trace your application's heap usage. To help you set up trace points for this use case, Qt Creator packages a shell script you can execute and prompts you to run it. First, open your project and choose the run configuration you want to examine. Then just select the "Create trace points ..." button on the Analyzer title bar and you get:

How does it work?
In order for non-privileged users to be able to use the trace points the script has to make the kernel debug and tracing file systems available to all users of the system. You should only do this in controlled environments. The script will generally work for 32bit ARM and 64bit x86 systems. 64bit ARM systems can only accept the trace points if you are using a Linux kernel of version 4.10 or greater. In order to set trace points on 32bit x86 systems you need to have debug symbols for your standard C library available
The script will try to create trace points for any binary called libc.so.6 it finds in /lib. If you have a 64-bit system with additional 32-bit libraries installed, it will try to create trace points for both sub-architectures. It may only succeed for one of them. This is not a problem if your application targets the sub-architecture for which the script succeeded in setting the trace points.
Troubleshooting
If the trace point script fails, you may want to check that your kernel was compiled with the CONFIG_UPROBE_EVENT option enabled. Without this option the kernel does not support user trace points at all. All 32-bit ARM images shipped with Qt for Device Creation have this option enabled from version 5.11 on. Most Linux distributions intended for desktop use enable CONFIG_UPROBE_EVENT by default.
Using trace points for profiling
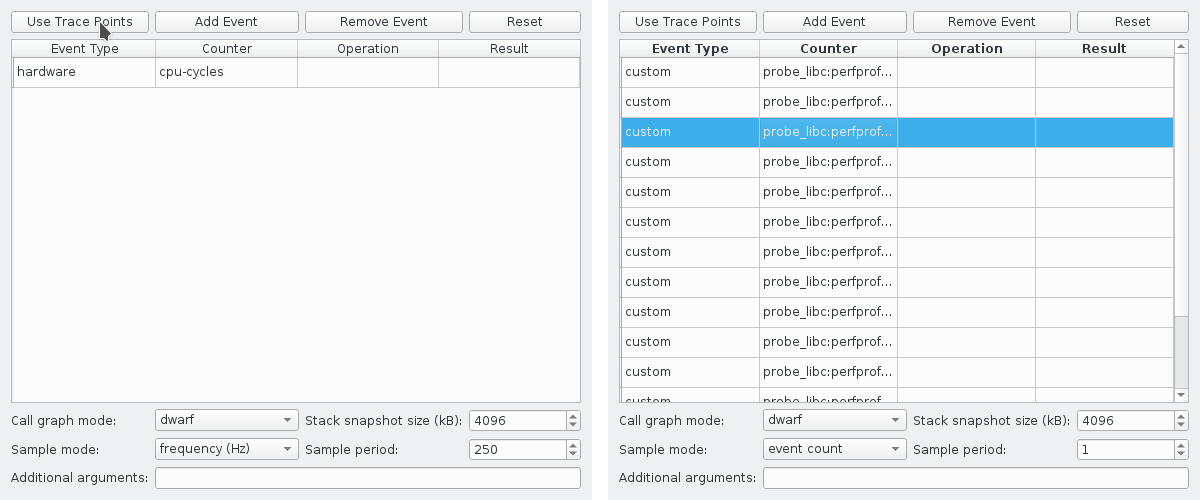
After creating the trace points, you need to tell Qt Creator to use them for profiling. There is a convenient shortcut for this in the Performance Analyzer Settings. You can access the settings either for your specific project in the "Run" settings in "Projects" mode, or globally from the "Options" in the "Tools" menu. Just select"Use Trace Points". Then Qt Creator will replace your current event setup with any trace points it finds on the target system, and make sure to record a sample each time a trace point is hit.
After this, you only need to press the "Start" button in the profiler tool bar to profile your application. After the application terminates, Qt Creator collects the profile data and displays it.
Interpreting the data
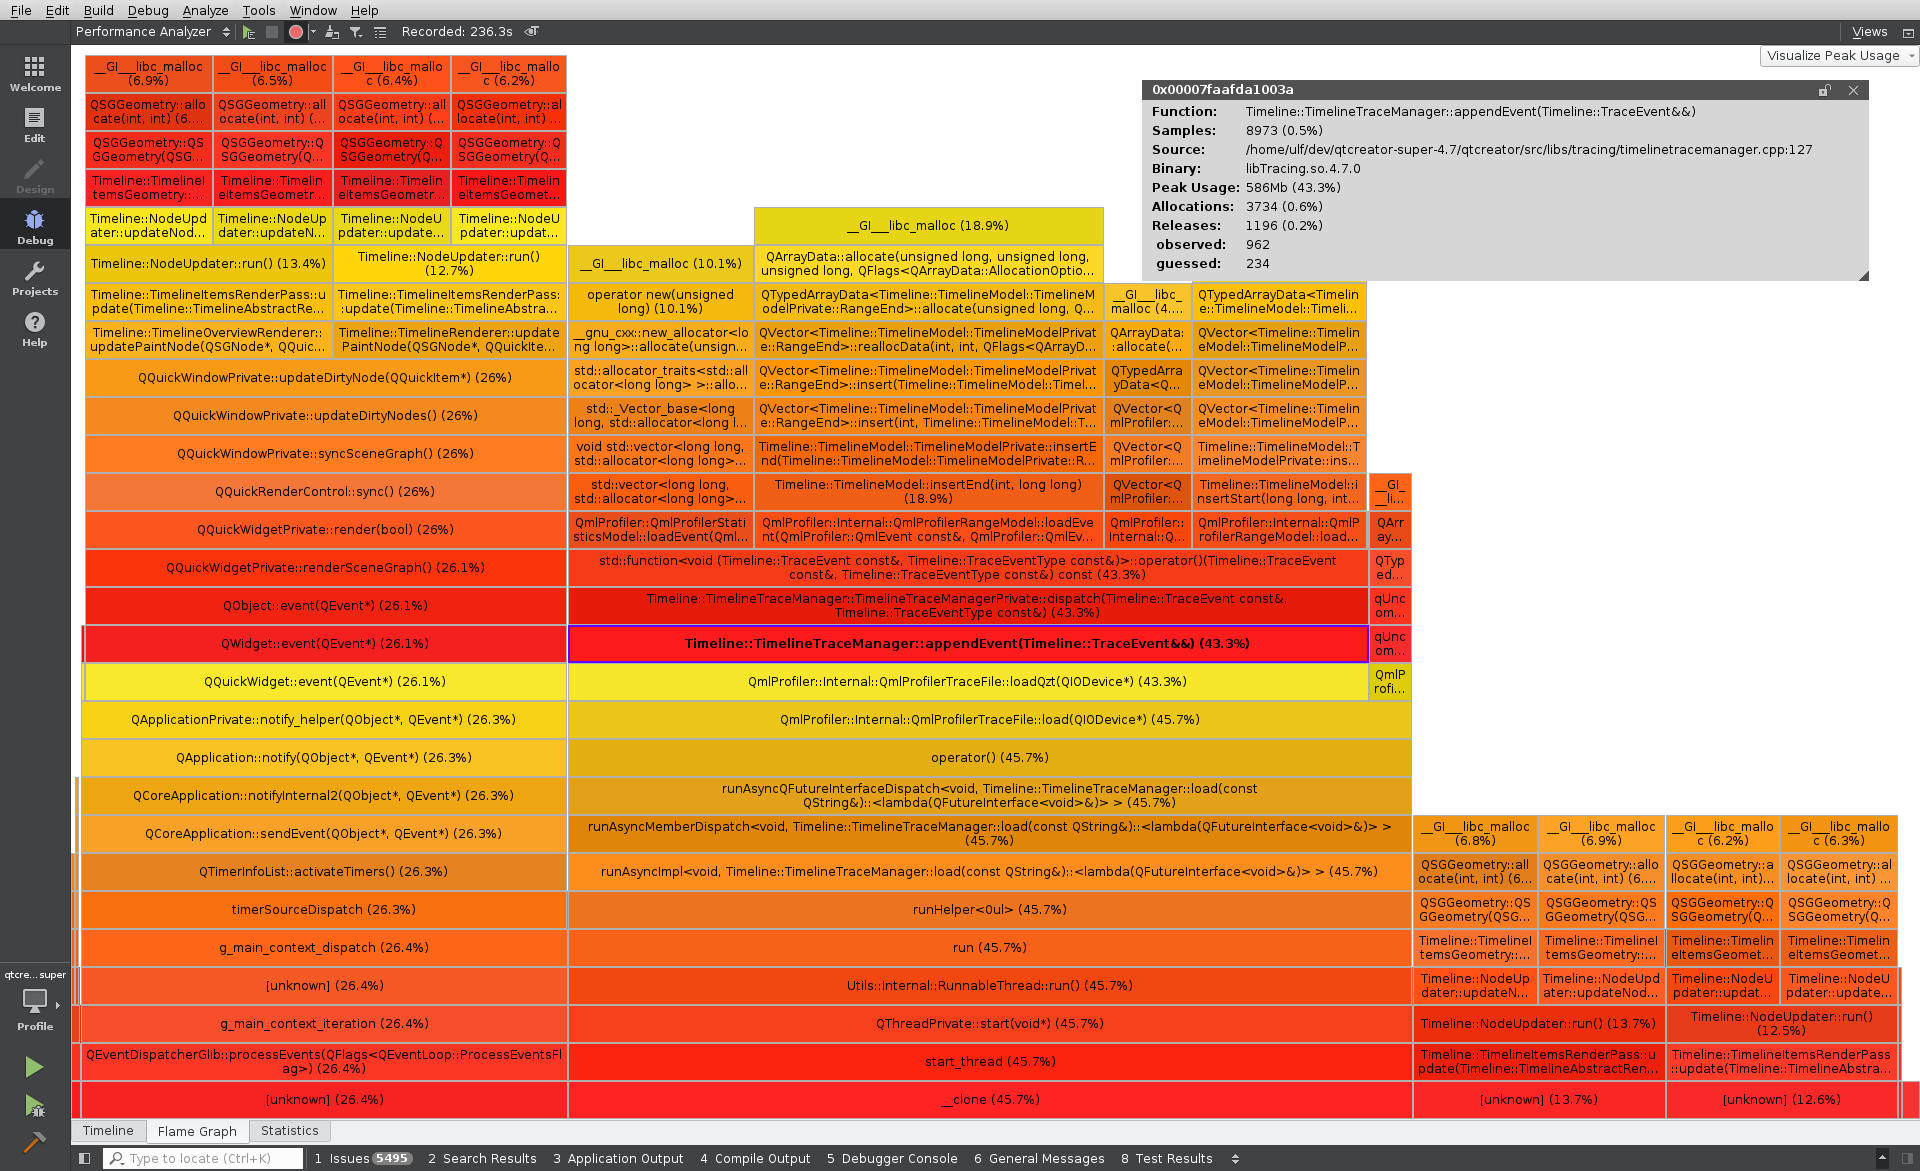
The easiest way to figure out which pieces of code are wasting a lot of memory is by looking at the flame graph view. In order to get the most meaningful results, choose the "Peak Usage" mode in the top right. This will show you a flame graph sorted by the accumulated amount of memory allocated by the given call chains. Consider this example:
Findings
What you see here is a profile of Qt Creator loading a large QML trace into the QML Profiler. The QML profiler uses a lot of memory when showing large traces. This profile tells us some details about the usage. Among other things this flame graph tells us that:
- The models for Timeline, Statistics, and Flame Graph views consume about 43% of the peak memory usage. TimelineTraceManager::appendEvent(...) dispatches the events to the various models and causes the allocations.
- Of these, the largest part, 18.9% is for the Timeline range models. The JavaScript, Bindings, and Signal Handling categories are range models. They keep a vector of extra data, with an entry for each such range. You can see the QArrayData::allocate(...) that allocates memory for these vectors.
- Rendering the Timeline consumes most of the memory not allocated for the basic models. In particular Timeline::NodeUpdater::run() shows up in all of the other stack traces. This function is responsible for populating the geometry used for rendering the timeline categories. Therefore, QSGGeometry::allocate(...) is what we see as direct cause for the allocations. This also tells us why the QML profiler needs a graphics card with multiple gigabytes of memory to display such traces.
Possible Optimizations
From here, it's easy to come up with ideas for optimizing the offending functions. We might reconsider if we actually need all the data stored in the various models, or we might temporarily save it to disk while we don't need it. The overwhelming amount of geometry allocated here also tells us that the threshold for coalescing adjacent events in dense trace might be too low. Finally, we might be able to release the geometry in main memory once we have uploaded it to the GPU.
Tracing Overhead
Profiling each and every malloc() and free() call in your application will result in considerable overhead. The kernel will most likely not be able to keep up and will therefore drop some of the samples. Depending on your specific workload the resulting profile can still give you relevant insights, though. In other words: If your application allocates a huge amount of memory in only a handful of calls to malloc(), while also allocating and releasing small amounts at a high frequency, you might miss the malloc() calls you are interested in because the kernel might drop them. However, if the problematic malloc() calls form a larger percentage of the total number of calls, you are likely to catch at least some of them.
In any case, Qt Creator will present you with absolute numbers for allocations, releases, and peak memory usage. These numbers refer to the samples perf actually reported, and therefore are not totally accurate. Other tools will report different numbers.
Special allocation functions
Furthermore, there are memory allocation functions you cannot use for profiling this way. In particular posix_memalign() does not return the resulting pointer on the stack or in a register. Therefore, we cannot record it with a trace point. Also, custom memory allocators you may use for your application are not handled by the default trace points. For example, the JavaScript heap allocator used by QML will not show up in the profile. For this particular case you can use the QML Profiler, though. Also, there are various drop-in replacements for the standard C allocation functions, for example jemalloc or tcmalloc. If you want to track these, you need to define custom trace points.
Conclusion
Profiling memory usage with Qt Creator's Performance Analyzer is an easy and fast way to gain important insights about your application's memory usage. It works out of the box for any Linux targets supported by Qt Creator. You can immediately browse the resulting profile data in an easily accessible GUI, without any further processing or data transfer. Other tools can produce more accurate data. However, for a quick overview of your application's memory usage the Performance Analyzer is often the best tool.